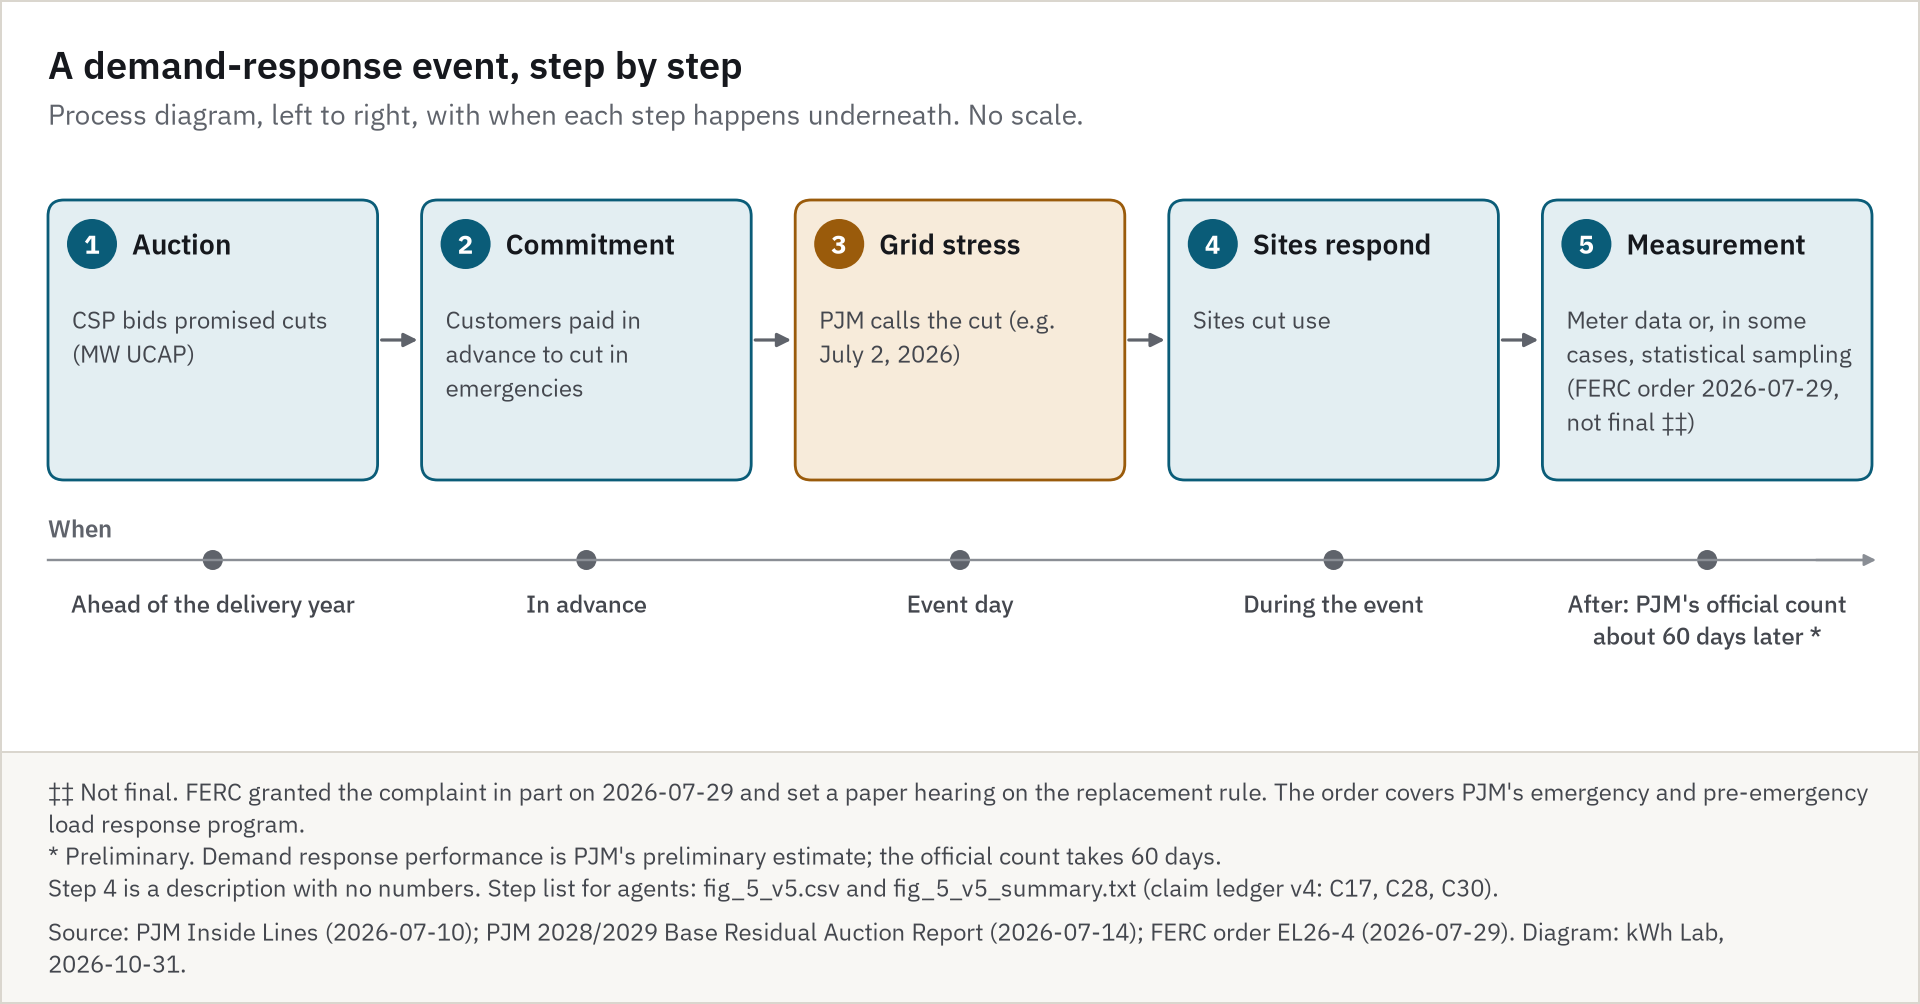
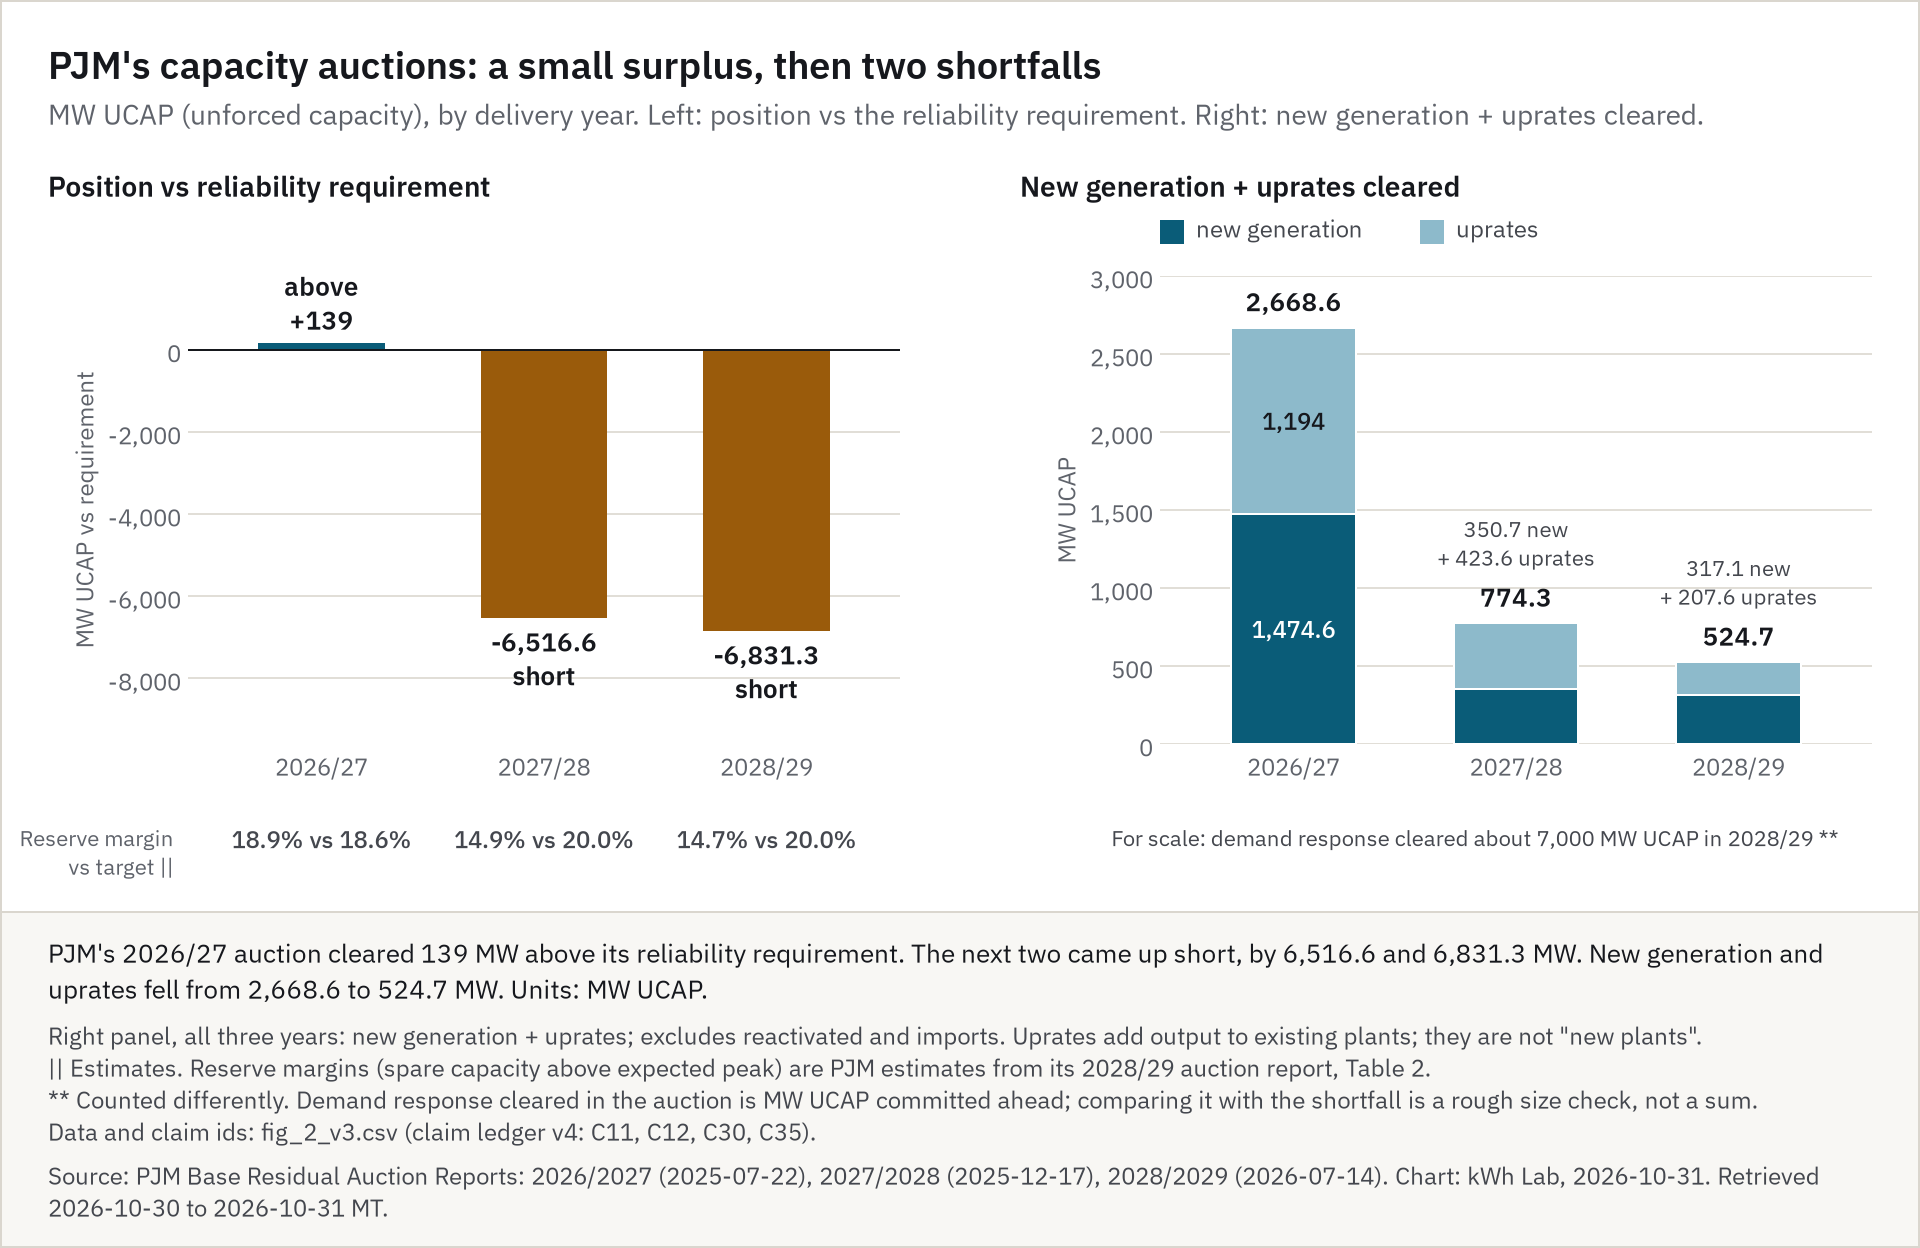
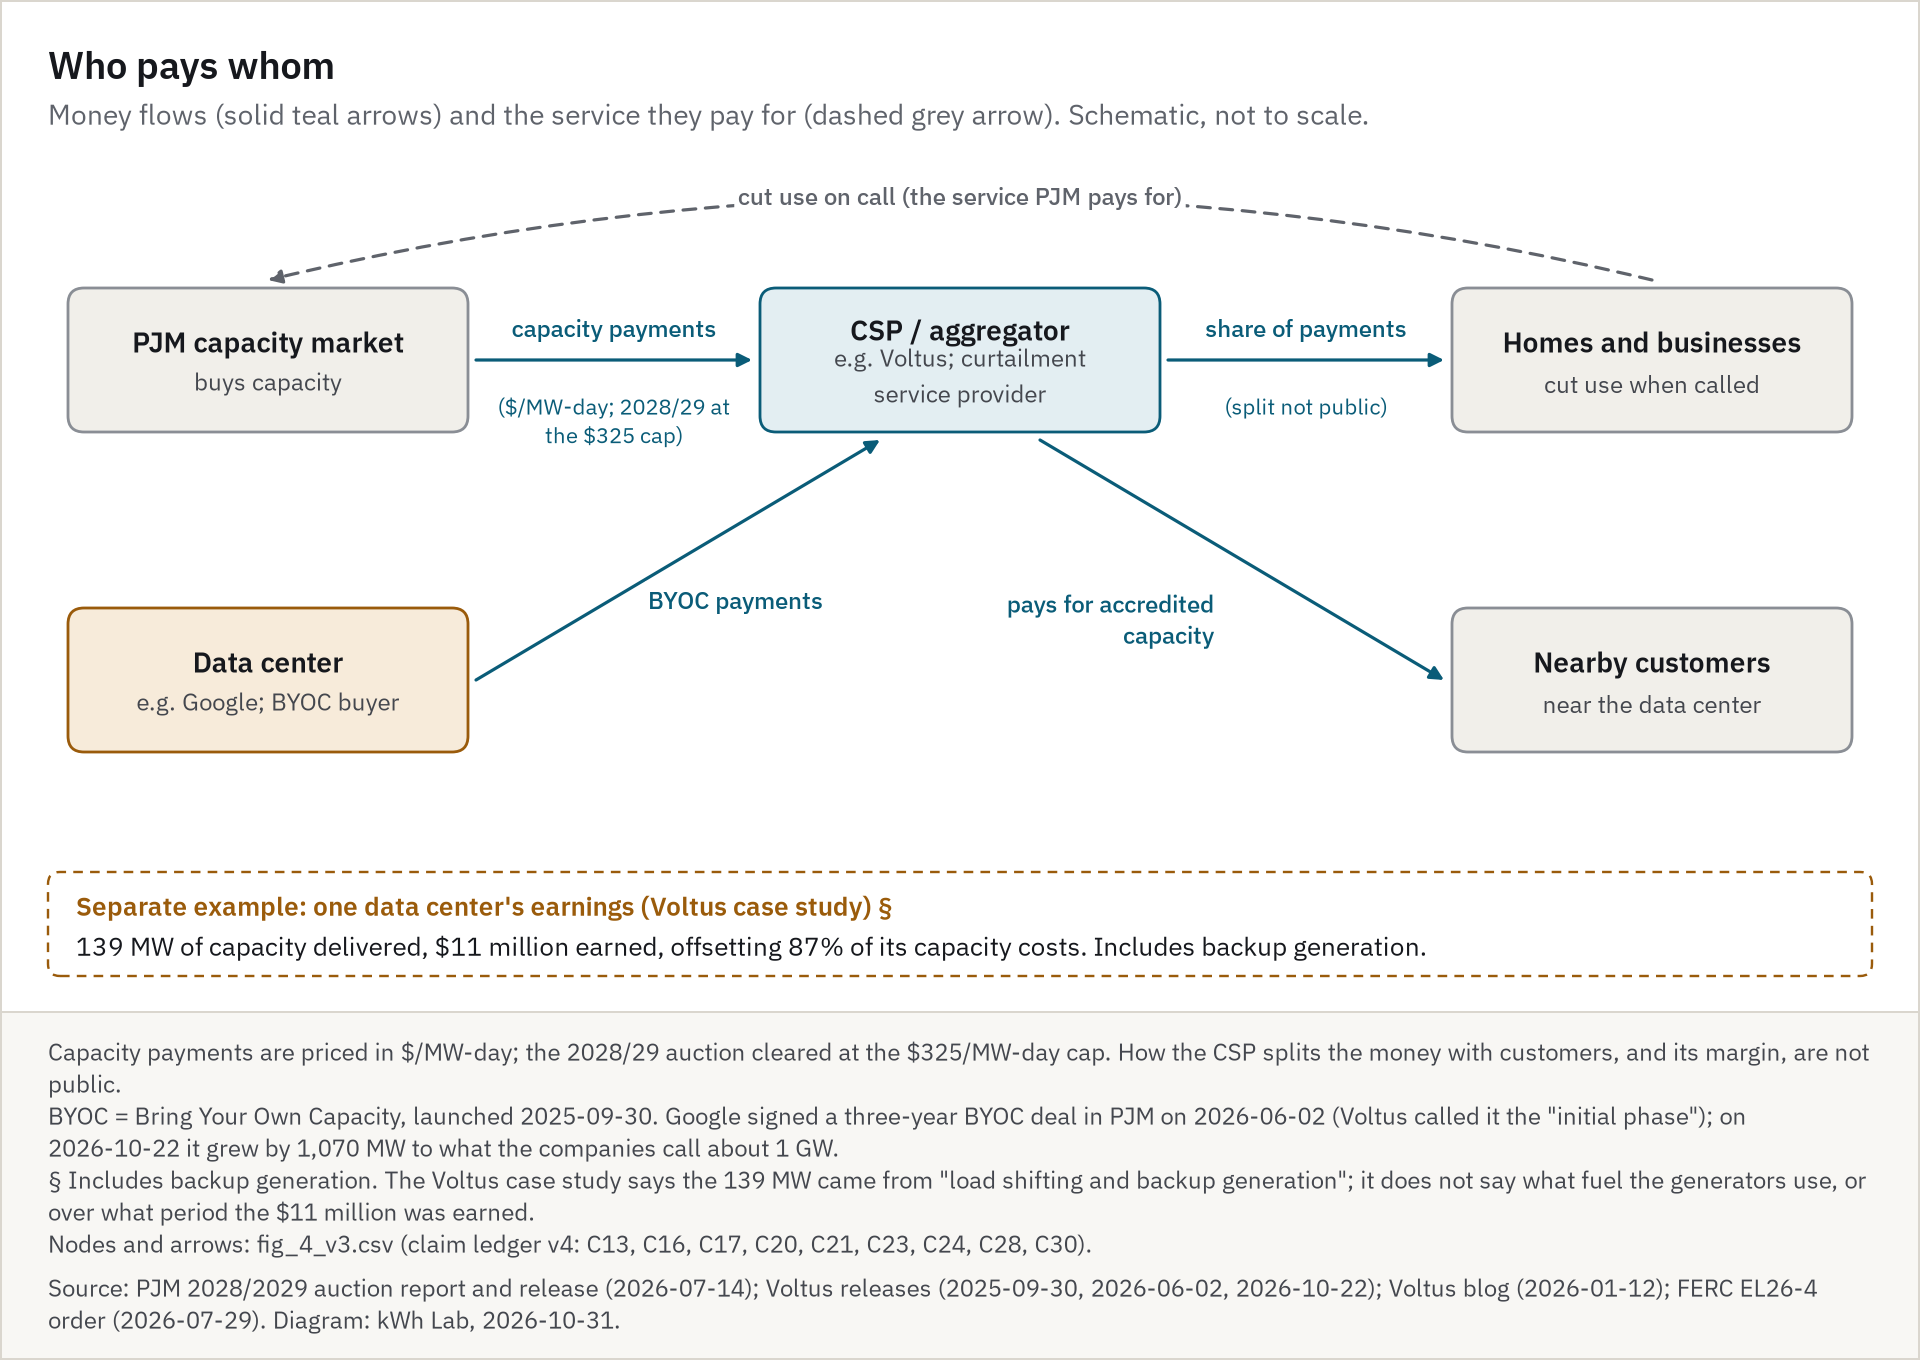
Describe the map, step by step
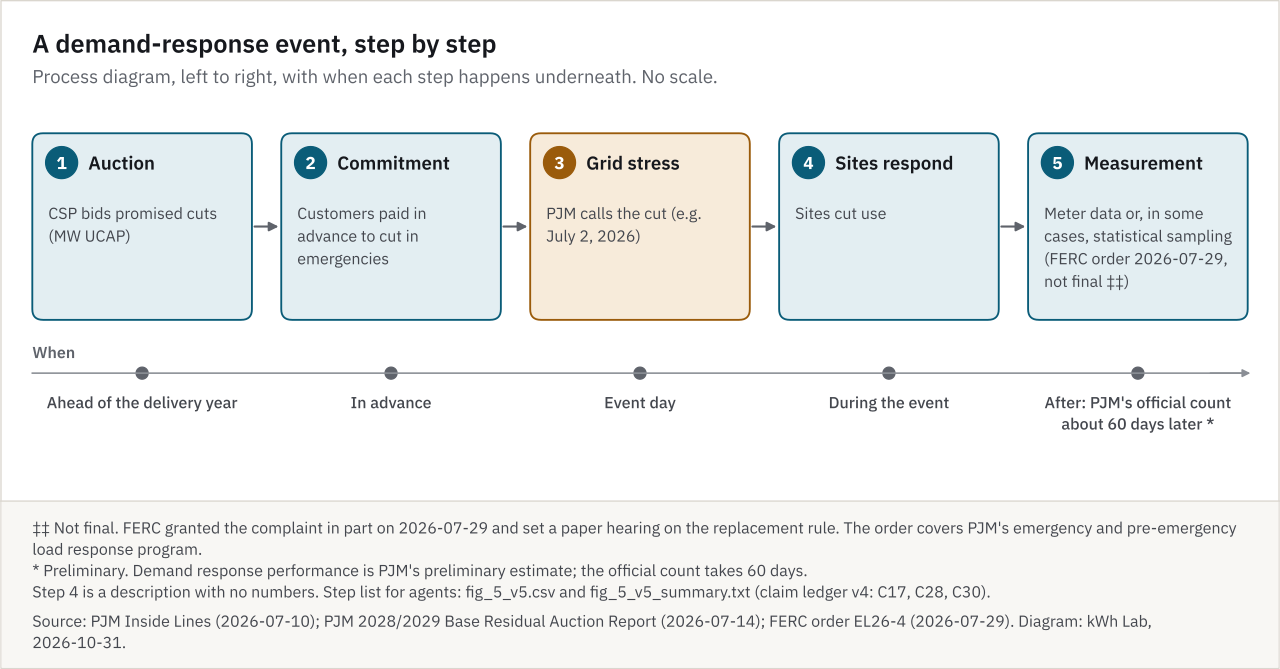
Process map, 6 steps in order. Top row, left to right: 1 What a virtual power plant is (Voltus says it manages about 8.5 GW.‡); 2 Grid demand peaks (EXAMPLE; Peak ≈1,050 MW, 18:00); 3 The grid operator sends a dispatch signal (EXAMPLE; Notice 15:00 · Dispatch event 16:00–20:00). An arrow goes down to the bottom row, right to left: 4 Each resource responds, and the responses stack (EXAMPLE; Batteries 40; Backup generators 25 §; Flexible loads 35→25; Stacked: about 100 MW); 5 Together they act like one power plant (EXAMPLE; Peaker need, up to 90 MW (EXAMPLE, illustrative, not sourced).; The VPP's 90-100 MW net reduction covers that gap.); 6 Real scale: PJM on its record day, July 2, 2026 (Estimated unrestricted peak *: 168,158 MW; Served peak, 17:55 *: 162,713 MW; Demand response *, ≈3.6% of est. peak: 6,113 MW; Measured differently; they don't add up.). A dashed box marks steps 2-5: Steps 2-5 use EXAMPLE values. Markers: * preliminary, ‡ company figure, § includes backup generation.
Step 1 of 6: What a virtual power plant is
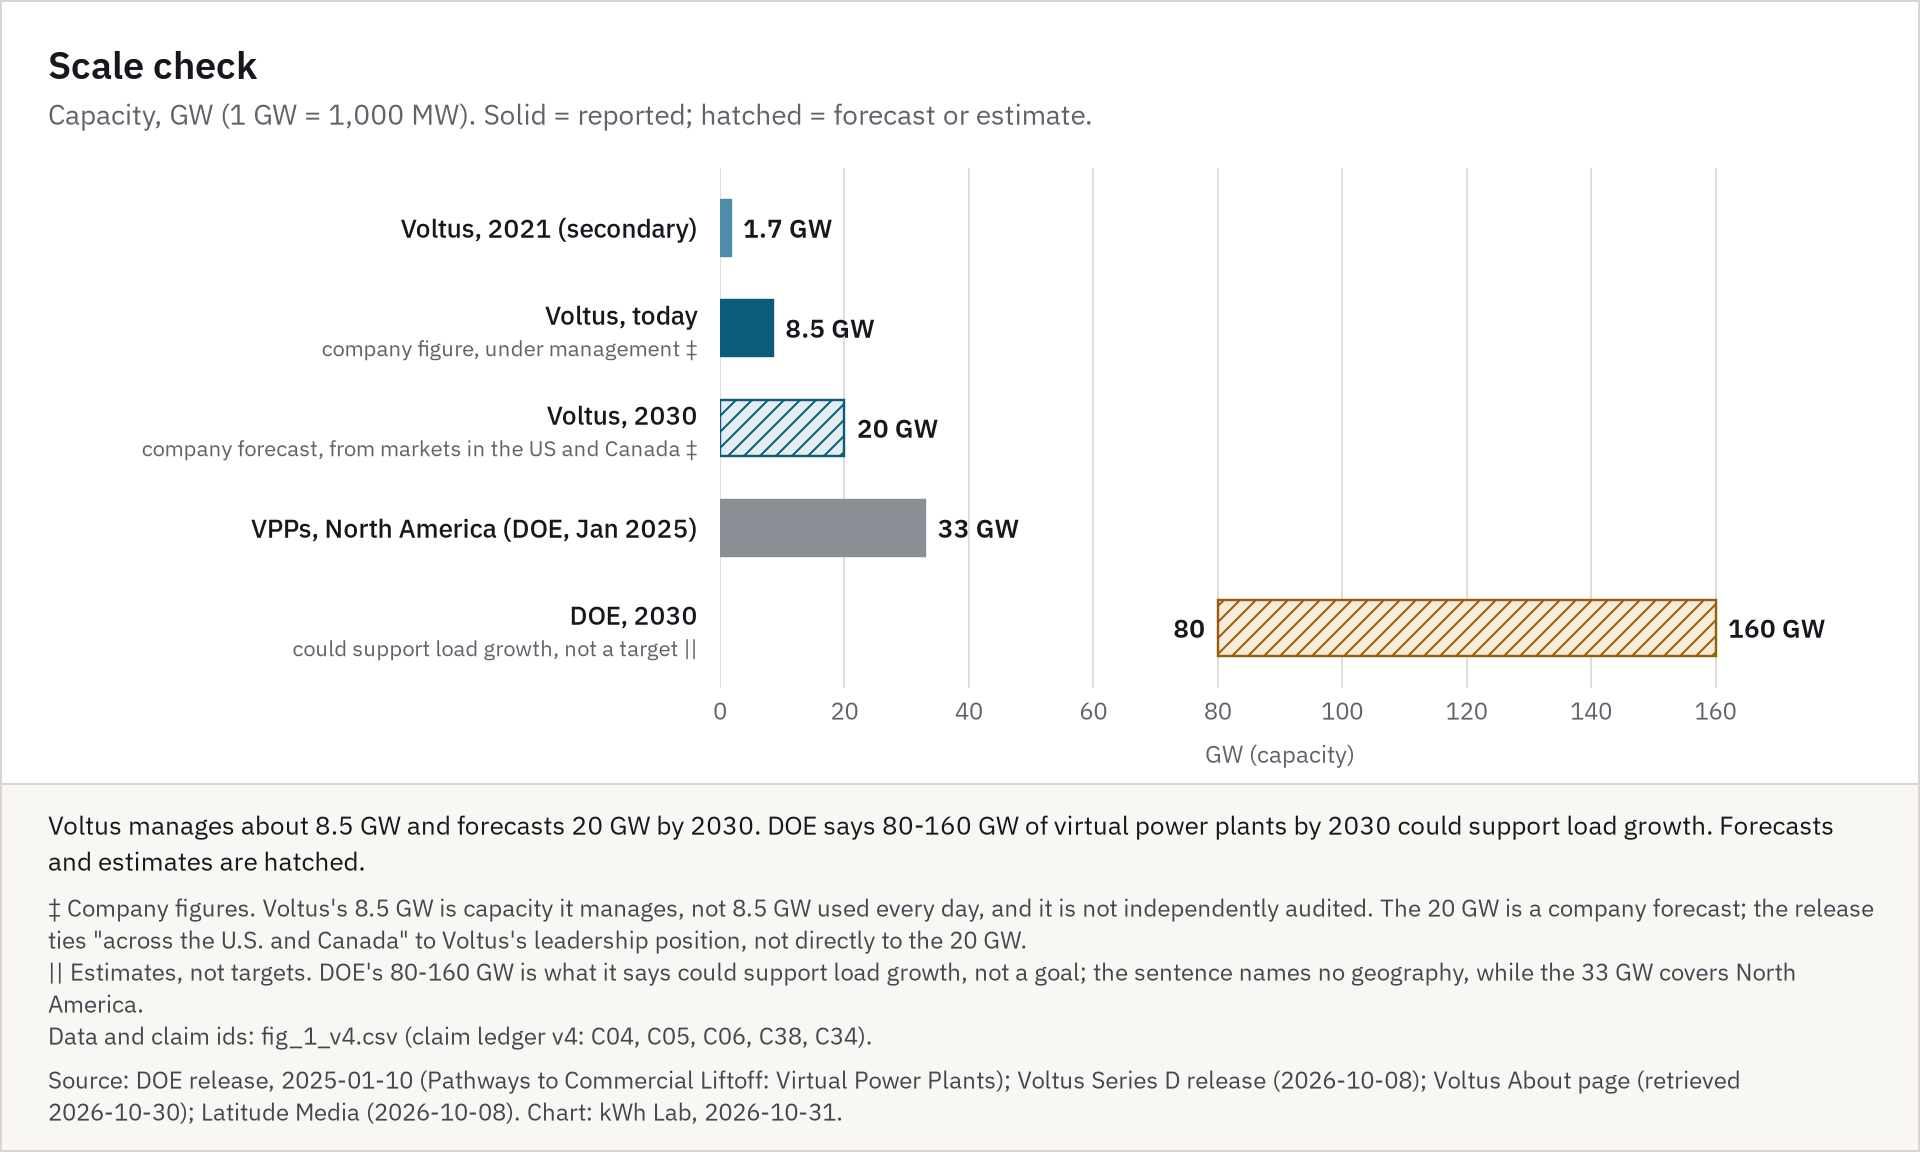
Diagram, no axes. A virtual power plant (VPP) is software that links many sites so they act like one plant. The grid operator sends a signal; the aggregator's software tells batteries, backup generators and flexible loads to respond, and the cuts add up. Voltus, one aggregator, says it manages about 8.5 GW of customer-side resources.‡
Sources: definition from our report, section 3 'How using less becomes a power plant'; Voltus About page, retrieved 2026-10-30 [C05 ‡].
Step 2 of 6: Grid demand peaks (EXAMPLE)
x: local time 12:00-22:00; y: MW of demand in the example area (600-1,100). On a hot afternoon, demand in this example area climbs to about 1,050 MW around 18:00. Supply available without a peaker is 960 MW, so from 16:45 to 19:15 demand runs above it (shaded).
EXAMPLE: illustrative scenario drawn by kWh Lab, not measured data; our sources have no hourly or per-resource data. Kinds of response: our report, section 3 'How using less becomes a power plant'. Built 2026-10-31. For scale, PJM's preliminary instantaneous peak was 162,713 MW at 17:55 on 2026-07-02 (not plotted): PJM DISRS presentation: Hot Weather Operations and Load Management Events, July 2-3 (Scott Baker, 2026-08-03) [C37 *].
Step 3 of 6: The grid operator sends a dispatch signal (EXAMPLE)
x: local time 12:00-22:00; y: MW of demand (600-1,100); signal lane above the chart. Ahead of the peak the grid operator sends a notice, then calls the event. The aggregator's software passes the signal on to enrolled sites. Customers were paid in advance to respond.
EXAMPLE: illustrative scenario drawn by kWh Lab, not measured data; our sources have no hourly or per-resource data. Kinds of response: our report, section 3 'How using less becomes a power plant'. Built 2026-10-31. Paid in advance: PJM Inside Lines: PJM Serves Load Through Record-Breaking July Heat (2026-07-10) [C28].
Step 4 of 6: Each resource responds, and the responses stack (EXAMPLE)
x: local time 12:00-22:00; y: MW of response from the example VPP (-20 to 120), stacked. Nothing responds before the 16:00 start. Batteries reach full output (40 MW) by 16:15. Backup generators add 25 MW from 16:30.§ Flexible loads, such as cooling and freezers, give 35 MW at first and less as buildings drift warmer, then use a little extra after the event (rebound). Stacked, they reach about 100 MW. EXAMPLE: the event (16:00-20:00) is wider than the gap (16:45-19:15), so the VPP cuts more than needed at the start and end.
EXAMPLE: illustrative scenario drawn by kWh Lab, not measured data; our sources have no hourly or per-resource data. Kinds of response: our report, section 3 'How using less becomes a power plant'. Built 2026-10-31. § Backup generation is generation, not using less; fuel not stated in the source: Voltus blog: PJM Capacity Auction Results 2027/2028: What C&I Facilities Need to Know [C24]. DOE let PJM direct backup generation as a last resort: DOE Newsroom: Energy Secretary Secures Mid-Atlantic Grid Ahead of Period of Hot Weather (2026-06-30) [C39].
Step 5 of 6: Together they act like one power plant (EXAMPLE)
x: local time 12:00-22:00 (shared). Top y: MW of demand (800-1,100). Bottom y: MW (0-100), VPP net reduction vs peaker need. Without the VPP, a peaker plant would have to supply the gap above the 960 MW line: Peaker need, up to 90 MW (EXAMPLE, illustrative, not sourced). The VPP's net reduction covers that gap through the peak: at 18:00 it cuts demand from 1,050 MW to 955 MW. EXAMPLE: the event (16:00-20:00) is wider than the gap (16:45-19:15), so the VPP cuts more than needed at the start and end.
EXAMPLE: illustrative scenario drawn by kWh Lab, not measured data; our sources have no hourly or per-resource data. Kinds of response: our report, section 3 'How using less becomes a power plant'. Built 2026-10-31. Peaker need: EXAMPLE, illustrative, not sourced.
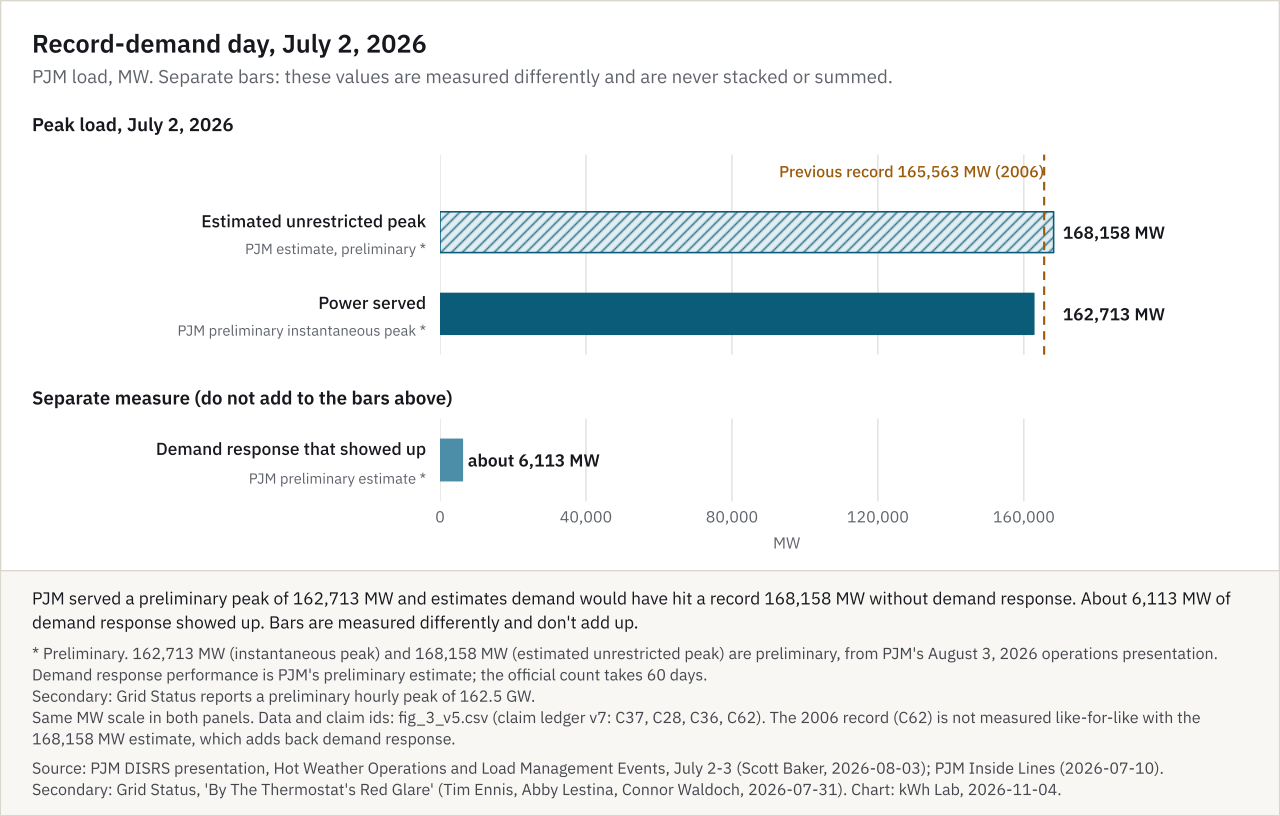
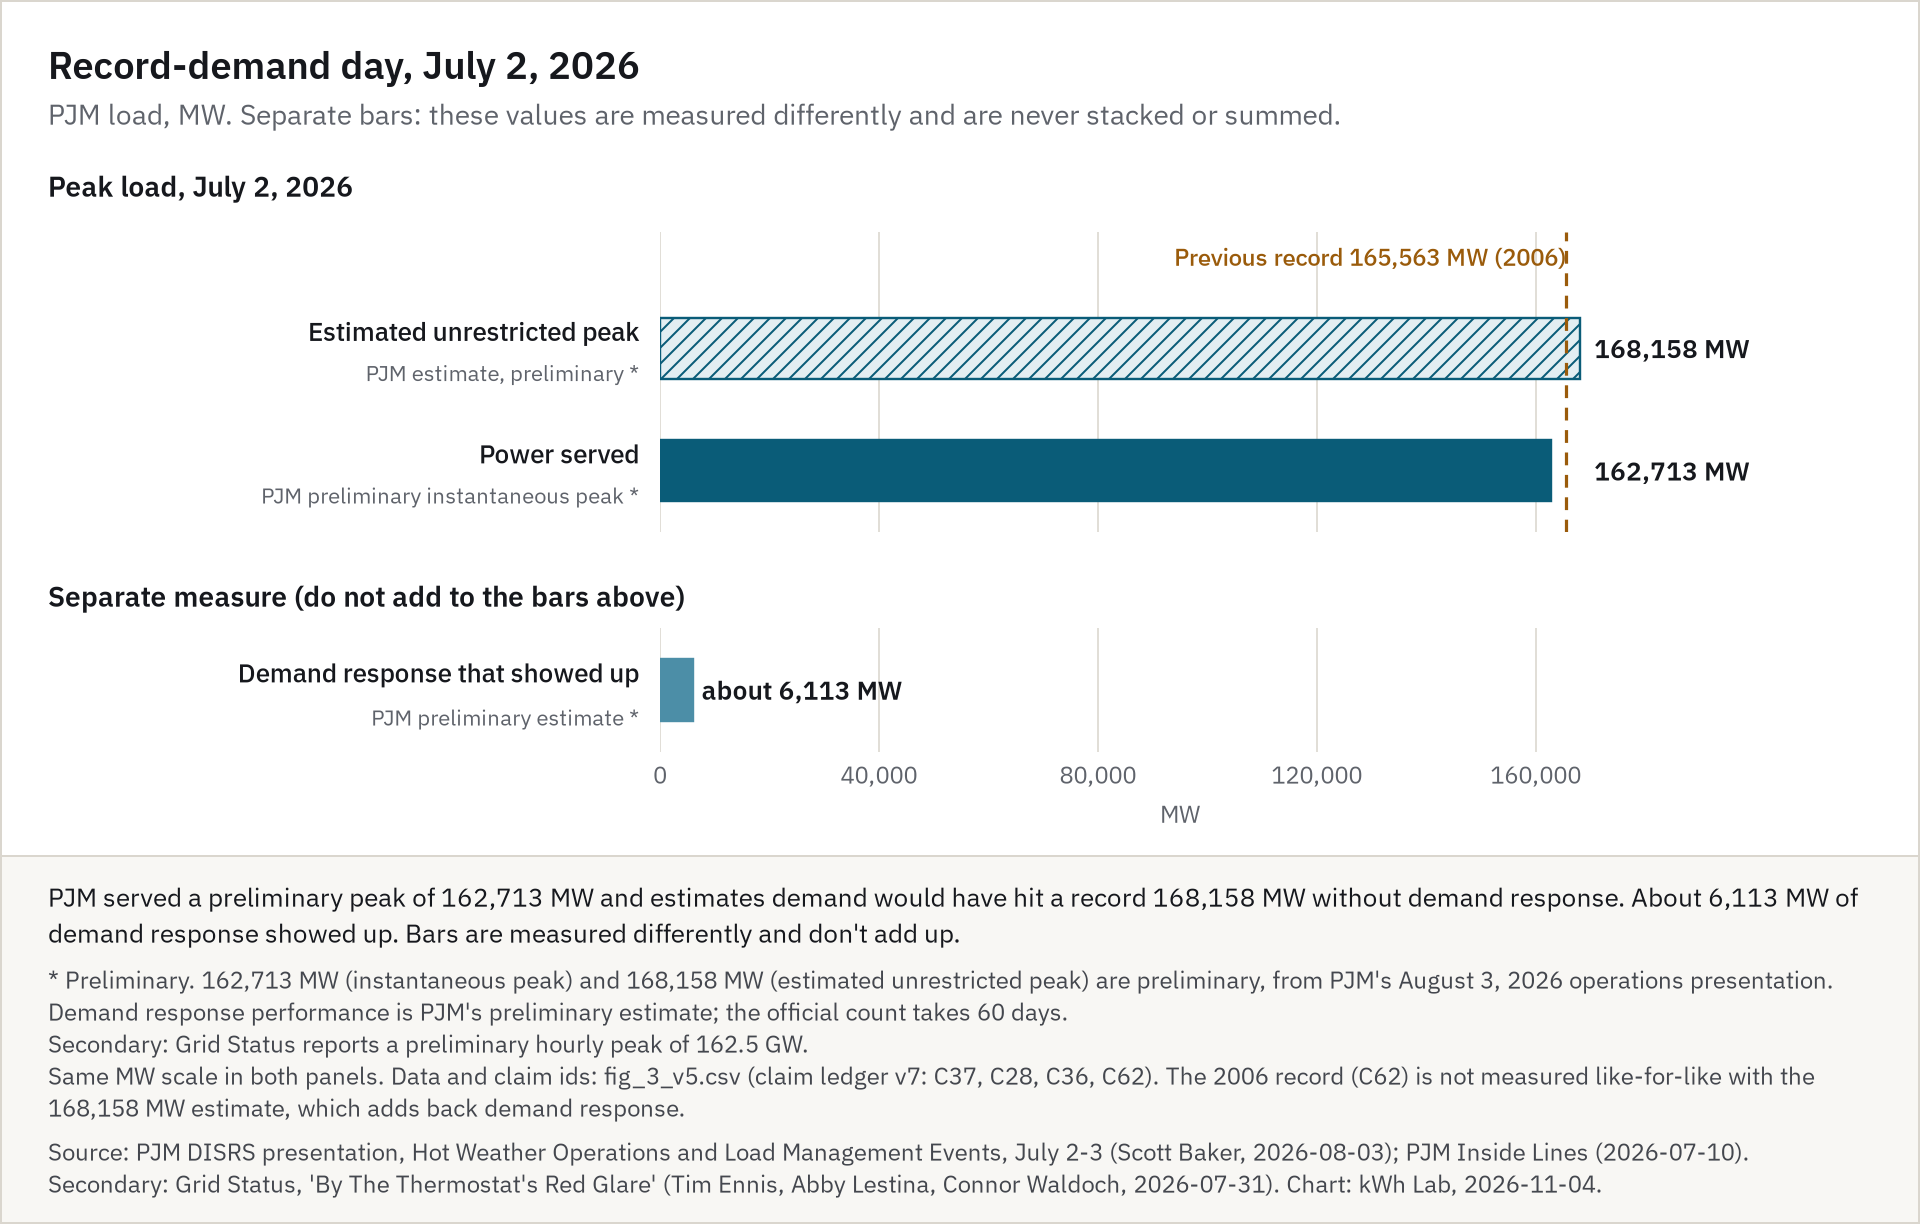
Step 6 of 6: Real scale: PJM on its record day, July 2, 2026
Horizontal bars; x: MW (0-170,000). Separate bars, not stacked. On July 2, 2026, PJM served a preliminary peak of 162,713 MW and estimates demand would have reached 168,158 MW without the load that demand response held down.* About 6,113 MW of demand response showed up, about 3.6% of the estimated peak.* The three numbers are measured differently and don't add up.
Sources: PJM DISRS presentation: Hot Weather Operations and Load Management Events, July 2-3 (Scott Baker, 2026-08-03), slide 2 [C37 *]; PJM Inside Lines: PJM Serves Load Through Record-Breaking July Heat (2026-07-10) [C28 *]; 3.6% is our own calculation (6,113 / 168,158), our report, section 5 'Flexibility is already big'. * preliminary.
Data: EXAMPLE data (CSV, illustrative) · real figures (CSV).