1. Highest Land Productivity (LER 1.34)
Pairing 6 North–South vertical bifacial rows (288 panels / 158.4 kWdc) with 18 blueberry rows retains 85.5% of pure-farm fruit yield plus 48.2% of tracker solar MWh—earning $42,381/yr gross ($24,022/yr net), 2.6× pure berry profit.
2. Fastest Solar Break-Even (11.2 Yrs)
With zero motors, slew drives, or actuators, fixed vertical Agri-PV needs $69k–$140k less net CAPEX than fixed-tilt or 0.35 GCR tracker options—breaking even in 11.2 yrs (30% ITC) or 8.2 yrs when stacked with a 25% USDA REAP farm grant.
3. Solves the 6-Year Crop Ramp
Newly planted blueberries produce zero commercial fruit in Years 1–2 and take 7 years to mature. Vertical solar generates +$16,181/yr net cash on Day 1 while keeping 33 ft lanes permanently open for over-the-row straddle harvesters.
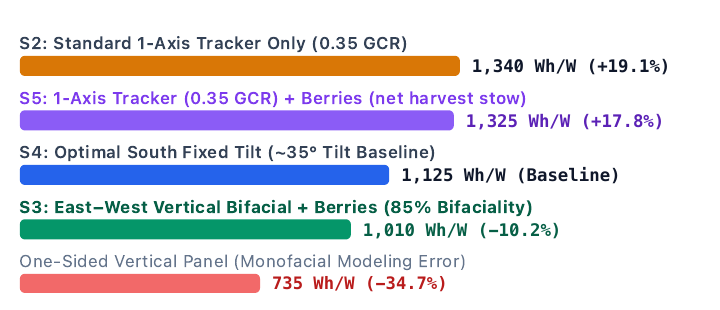
1. SOLAR PHYSICS REALITY CHECK: SPECIFIC YIELD IN WESTERN OREGON (WH / W / YR)
45.5°N TMY Irradiance · ~50% Diffuse Sky Fraction
Correcting the "735 Wh/W (-53%)" Claim: Dropping from 1,125 Wh/W (optimal south fixed-tilt) to 735 Wh/W is a 34.7% reduction (390 ÷ 1,125, not 390 ÷ 735 = 53%)—and 735 Wh/W models a one-sided monofacial wall.
East–West Bifacial Recovery (1,010 Wh/W): Commercial 85% glass-glass bifacial modules harvest morning beam sun on the East face, late-afternoon sun on the West face, and scattered sky light on both faces all day—trailing south fixed-tilt by only 10.2%.
Twin-Peak Grid Value ($0.115 vs. $0.105/kWh): Vertical E–W output peaks at 7–10 AM and 4–7 PM, avoiding midday wholesale solar cannibalization and aligning with utility Time-of-Use (TOU) ramps.
2. FIVE-SCENARIO MASTER TECHNO-ECONOMIC COMPARISON (1-ACRE SQUARE)
550 Wdc Bifacial Modules · OSU Commercial 'Calypso' Blueberry Budgets
| Metric (1 Acre = 43,560 sq ft) | S1: Berries Alone | S2: 1-Axis Tracker PV | S4: South Fixed-Tilt PV | S3: Vertical PV + Berries | S5: 0.35 GCR Tracker + Berries |
|---|---|---|---|---|---|
| Solar Array Size (550 Wdc Panels) | 0 | 450 (247.5 kW) | 450 (247.5 kW) | 288 (158.4 kW) | 432 (237.6 kW) |
| Row Pitch / Collector GCR | 10 ft crop pitch | 21.3 ft (0.35 GCR) | 39.5 ft (0.36 GCR) | 33.0 ft alleys | 21.3 ft (0.35 GCR) |
| Year-1 Electricity Output | 0 kWh | 331,650 kWh | 278,438 kWh | 159,984 kWh | 314,820 kWh |
| Blueberry Rows / Mature Yield (Yr 7+) | 20 (17,000 lbs) | 0 (0 lbs) | 0 (0 lbs) | 18 (14,535 lbs) | 10 (6,630 lbs)* |
| Mature Gross Revenue / Yr | $28,050 | $34,823 | $29,236 | $42,381 | $43,996 |
| Mature Cash Operating Cost / Yr | $18,850 | $5,445 | $3,713 | $18,359 | $13,545 |
| Mature Net Cash Flow / Yr | $9,200 | $29,378 | $25,523 | $24,022 | $30,451 |
| Upfront Gross CAPEX (0% Unsubsidized) | $24,500 | $482,625 | $415,800 | $307,170 | $511,210 |
| Upfront Net CAPEX (w/ 30% Solar ITC) | $24,500 | $337,838 | $291,060 | $221,634 | $361,522 |
| Cash Break-Even (w/ 30% Solar ITC) | 8.2 yrs | 11.8 yrs | 11.7 yrs | 11.2 yrs (Fastest PV) | 12.9 yrs (Slowest) |
| Cash Break-Even (0% Unsubsidized) | 8.2 yrs | 17.1 yrs | 17.0 yrs | 14.9 yrs | 18.1 yrs |
| Break-Even (30% ITC + 25% USDA REAP) | Ineligible | Ineligible | Ineligible | 8.2 yrs ($150.4k) | 8.6 yrs* ($236.8k) |
| 25-Yr Cumulative Net Profit (30% ITC) | $154,150 | $356,085 | $308,886 | $313,359 ($385k REAP) | $341,520 ($466k*) |
Model Basis: Blueberries ($24.5k/ac Yr-0 establishment, 0 lbs Yrs 1–2 ramping to 17,000 lbs/ac Yr 7+, $1.65/lb blended fresh/IQF price, $6.1k/ac cultural + $0.75/lb harvest cash cost). Solar CAPEX/O&M: Fixed South ($1.68/W, $15/kW-yr); 1-Axis Tracker ($1.95/W, $22/kW-yr); Fixed Vertical ($1.80/W, $14/kW-yr); Raised 0.35 GCR Agri-Tracker ($2.10/W, $24/kW-yr); 0.4%/yr degradation; $0.105/kWh base Oregon CSP/offset rate ($0.115/kWh TOU for vertical E–W; at flat $0.105/kWh, S3 nets $22,422/yr and breaks even in 12.1 yrs). *S5 retains only 39% of baseline crop yield, risking disqualification from EFU dual-use permitting and USDA REAP grants.
Blueberry Agro-Photovoltaics · 1-Acre Willamette Valley Techno-Economic BriefPage 1 of 2
3. 1-ACRE DUAL-USE GEOMETRY
208.7 ft × 208.7 ft
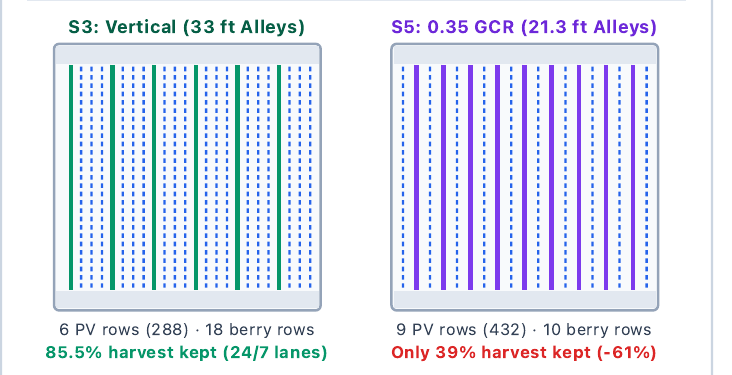
Harvester Bottleneck: Active rows span 182.4 ft N–S (13.15 ft turn headlands; 48 panels/row; 2-up landscape = 8.9 ft wall in S3). Two 10 ft berry rows + 11 ft Oxbo straddle harvester + post buffers need ≥23 ft—so S5's 21.3 ft alleys fit only 1 row/alley.
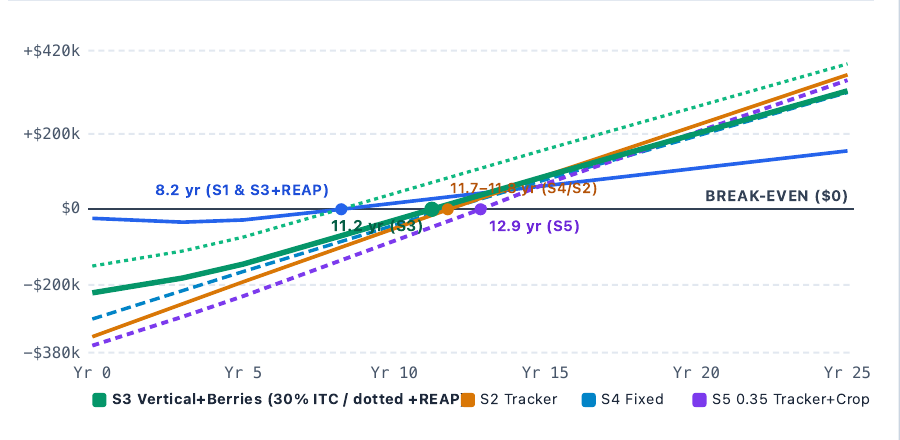
4. 25-YEAR CUMULATIVE NET CASH FLOW (30% ITC)
Includes Yrs 1–6 Berry Ramp & 0.4%/yr PV Degradation
For the Energy Analyst: Capital Efficiency & Siting
- Beats Fixed-Tilt Baseline (S3 vs. S4): S3 requires $69,426 less net CAPEX ($221.6k vs. $291.1k), earns +45% higher gross revenue, breaks even faster (11.2 vs. 11.7 yrs; 14.9 vs. 17.0 yrs unsubsidized), and yields higher 25-yr profit ($313.4k vs. $308.9k).
- Why 0.35 GCR Trackers Fail Dual-Use (S5): Raising 0.35 GCR trackers + stowing controls pushes net CAPEX to $361.5k/ac while shading out 61% of berries—resulting in the slowest payback (12.9 yrs), worse than pure trackers without crops (S2, 11.8 yrs).
- EFU Zoning & USDA REAP Unlock: Retaining 85.5% crop output preserves Oregon Class I–II EFU farmland eligibility and unlocks the 25% USDA REAP grant, cutting S3 payback to 8.2 yrs ($384.6k 25-yr net).
For the Farm Owner: Operations & Cash Resilience
- Zero Moving Parts, 24/7 Equipment Access: Unlike trackers that require motors, sensors, and software to rotate out of the way before spraying or harvesting, fixed vertical walls leave 33 ft lanes open permanently on the farmer's schedule.
- Eliminates the Establishment Cash Drain: Instead of sinking to -$34,300/ac by Year 3 waiting for young bushes to bear fruit, Day-1 solar revenue funds farm operations and boosts mature net income from $9,200/yr to $24,022/yr per acre.
- Microclimate Crop Protection: Partial morning/late-afternoon wind and heat buffering reduces Pacific Northwest summer heat-dome sunburn and cuts drip irrigation demand by ~20%.
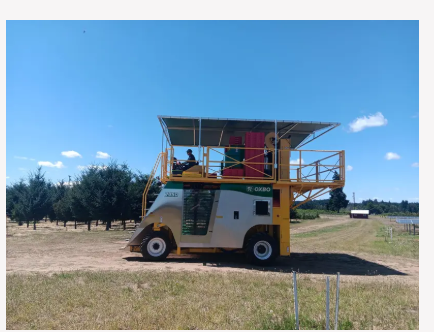
5. REAL-WORLD FIELD REFERENCE: OREGON STATE UNIVERSITY (NWREC SOLAR HARVEST SITE)
45°16'45.5"N 122°45'07.1"W · Aurora, Oregon
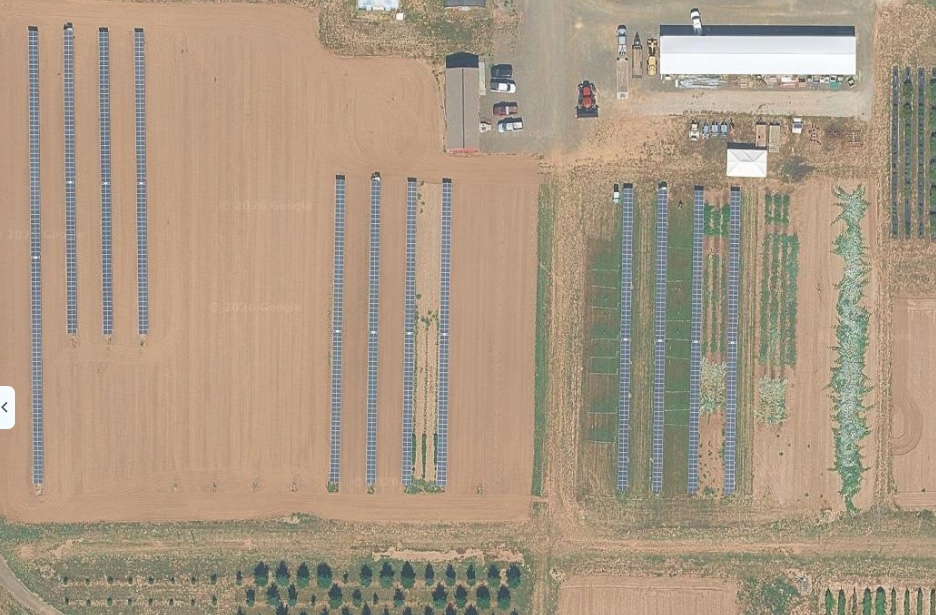
Site: North Willamette Research & Extension Center (NWREC), Oregon State University — 15210 NE Miley Rd, Aurora, OR 97002 (Plus Code: 76JX+HR).
Field Trial Context: Home to OSU's 5-acre, 320 kW Solar Harvest facility (established 2023; 'Calypso' northern highbush blueberries planted Oct 2024 in wide straddle-harvester lanes, with first side-by-side yield & Brix results scheduled for 2027). Notice in the satellite view how wide alley geometry is mandatory for tractor and harvester passage.
Interactive Satellite Map & Facility Links:
📍 https://www.google.com/maps?q=45.279306,-122.751972&t=k&z=18
🏛️ https://agsci.oregonstate.edu/nwrec (OSU College of Agricultural Sciences)
Credits & Primary Data Sources: (1) Satellite Map & Geolocation: Map data and aerial imagery © 2026 Google (Google Maps Satellite View, 45°16'45.5"N 122°45'07.1"W, NWREC, Aurora, OR). (2) Agronomic & Field Trial Reference: Oregon State University (OSU) North Willamette Research and Extension Center Solar Harvest Project (Dr. Chad Higgins, Biological & Ecological Engineering; Dr. Scott Lukas, Northwest Berry Production); OSU Applied Economics Blueberry Enterprise Budgets (AEB 0061, AEB 0062, AEB 0075, AEB 0084). (3) Solar PV & Tariff Benchmarks: National Renewable Energy Laboratory (NREL) PVWatts® v8, System Advisor Model (SAM), and Dual-Use PV Cost Benchmarks (NREL/TP-6A20-77811 & NREL/TP-6A20-88816); Next2Sun mid-latitude vertical bifacial benchmarks; Oregon PUC / PGE Community Solar Program (Schedule 204); IRC §48E (30% ITC) & USDA Rural Energy for America Program (REAP).
Blueberry Agro-Photovoltaics · 1-Acre Willamette Valley Techno-Economic BriefPage 2 of 2